Understanding the Disconnect: How We Misjudge Probability
Written on
Chapter 1: The Polling Experiment
Recently, I stumbled upon a captivating mathematical experiment circulating online. It began with a straightforward probability question:
A bag holds 10 balls.
7 of these balls are red, while 3 are green.
If you draw one ball without looking, what color is it?
At first glance, this question seems dull. If we denote the event of drawing a red ball as ‘R’, then the probability of this event, P(R), is 0.7 or 70% (given that there are 7 red balls). Consequently, the probability of drawing a green ball, P(G), is 0.3 or 30% (as there are 3 green balls). So far, so good; nothing seems extraordinary about this task. But the real intrigue lies in the results of the poll that followed.
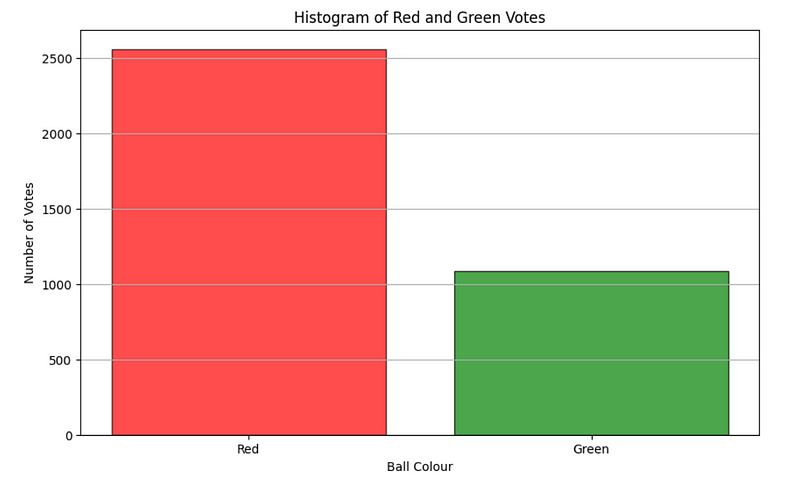
A total of 3,645 individuals participated in this poll, with 75.3% selecting red and 24.7% opting for green. A random participant noted that the results mirrored the expected probability distribution.

Ball Color vs. Number of Votes — Histogram created by the author
Upon further analysis, it became apparent that similar polls exhibited a recurring pattern, where the results closely reflected the actual probability distributions of the underlying question. However, I observed a more intriguing phenomenon: the votes tended to skew towards the more likely outcome, indicating a consistent bias among voters toward overestimating the probable result.
This observation sparked my curiosity.
Why does this happen? What implications does it hold for our everyday decisions? Throughout this essay, I aim to answer these questions, drawing from my own experiences related to this phenomenon.
Mental Math Simplified
As humans, we typically avoid complicating matters. Unlike the lengthy probability problems we tackle in school or university, real life often requires us to make snap decisions that carry significant consequences.
How do we manage this? Primarily through the biases and heuristics we develop from our experiences. These instinctive “shortcuts” allow us to make quick decisions based on our observations. However, while they often serve us well, they can also lead us astray.
To illustrate this, consider the following scenario:
Suppose you learn from a neighbor that they experienced food poisoning after dining at a local restaurant. Consequently, you inform your family that you will avoid that restaurant. When you inquire about what prompted your neighbor's visit, they mention that on three occasions, the restaurant staff appeared professional and organized. Additionally, the high prices on the menu suggested quality food, typically sourced from local producers.
At this point, you might wonder what this has to do with probability. Let's piece the puzzle together.
The Human Element of Probability
First, let’s examine your decision to avoid the restaurant. Just because your neighbor fell ill does not definitively implicate the restaurant as the cause. Although there’s a high probability that the restaurant is responsible, it’s not a certainty.
Moreover, even if the restaurant were indeed at fault, you wouldn’t be ordering the same meal. Your visit could occur at a different time, further reducing your chances of food poisoning.
If I were to encourage you to reconsider and visit the restaurant, you might respond, “Are you out of your mind? I’d rather not take that risk!”
This reaction is completely understandable. Here, you are likely overestimating the probability of illness based on recent events. The recency bias is at play, leading you to overvalue the probability and minimize risk.
While your mental calculation may be flawed, the outcome—choosing to protect yourself—is arguably wise. The alternative, dining at home, greatly reduces your risk of food poisoning.
Now, let’s examine what led your neighbor to choose the restaurant. Their impression of the staff’s professionalism and the high menu prices aligned with their mental model of a high-class establishment.
This reliance on stereotypes to make decisions reflects the representativeness heuristic, where quick judgments are formed based on past experiences. Unfortunately, this heuristic misfired for your neighbor, resulting in food poisoning.

Heuristics and Biases in Decision-Making
Your neighbor’s decision was influenced not only by their observations but also by the pricing. The high prices evoked memories of previous experiences at quality restaurants, demonstrating the anchoring heuristic—where numerical values shape our perceptions of quality.
This tendency isn’t uncommon. We often associate high prices with superior quality, which can lead to erroneous conclusions. For example, parents typically prefer to buy more expensive, reliable toys for their children, avoiding cheaper alternatives.
Unfortunately, in this instance, your neighbor's assumptions led to an unfortunate outcome.
Returning to the Polling Experiment
Let’s revisit the poll we discussed earlier:
A bag contains 10 balls.
7 balls are red.
3 balls are green.
You draw one ball without looking. What color is it?
Of the 3,645 voters, 75.3% selected red, while 24.7% opted for green. I observed a slight bias (approximately 5%) towards red, the more likely outcome.
What accounts for this bias? A mix of heuristics and biases could be at play. One might select red simply because it has received the most votes (confirmation bias). Conversely, I might choose green in an attempt to correct the perceived disparity between the voting ratio and the probability ratio (anchoring).
Others might be overly confident in their understanding of probability. Regardless, the collective effect leads voters to overestimate the likelihood of drawing a red ball.
Consequences of Groupthink in Probability Estimation
Imagine you’re considering purchasing a new property. If the prevailing sentiment is that the property’s price is likely to increase, potential buyers may collectively overestimate its current value, similar to the polling results. Consequently, you might end up overpaying for the property.
What options do you have? In this scenario, options appear limited, especially when the majority is in agreement. Brokers often exploit this phenomenon, capitalizing on the overestimation from both sides.
Alternatively, you could seek opportunities where the consensus underestimates the likelihood of price increases, allowing you to bid lower. While this approach requires time and effort, it could lead to more favorable outcomes than attempting to swim against the tide.
This behavior extends beyond real estate; it influences various markets, from trading cards to electronics. Personally, I have applied this mindset, combined with data analysis, to successfully identify undervalued items in markets such as collectibles.
The key lies in pausing to observe trends before taking action—easier said than done, of course. If it were straightforward, everyone would excel at it!
Chapter 2: Psychological Insights on Probability
The first video titled "How chance affects our lives way more than you think | The mathematics of randomness" explores the profound impact of randomness on our daily decisions and perceptions.
The second video "Everything wrong with statistics (and how to fix it)" delves into common statistical misconceptions and offers insights on improving our understanding of data and probability.