How to Create a Custom Value Investing Stock Screener in Python
Written on
Chapter 1: Introduction to Building a Stock Screener
Many investors, including myself, often shy away from traditional stock screeners, as they don't always present the data in the way I prefer. My main interest lies in a concise table showing revenue, EBIT, equity, and debt over recent years. I find that preliminary assessments do not require a deep dive into assets or liabilities; rather, I focus on whether a company is successfully growing its earnings year after year and how that growth is financed—through debt or equity. The more thorough analysis can come later.
To address this need, I decided to create my own stock screener, and I’m excited to share the process with you. This project will be executed in a Jupyter Notebook. When I refer to a screener, I mean screening one company at a time rather than evaluating numerous stocks simultaneously.
Section 1.1: Setting Up the API
For this tutorial, we will utilize Yahoo Finance. Specifically, I recommend the YH Finance API from RapidAPI, which provides the financials endpoint we need for our project. After registering for a RapidAPI account and selecting the basic plan, ensure you use the get-financials endpoint.
The basic plan allows for 500 free requests monthly, which is more than sufficient for our requirements. Additionally, RapidAPI has a convenient feature where the code for calling the API is pre-written for you, located on the right side of the interface.
Section 1.2: Importing Necessary Libraries
To start, we need to import a few essential libraries in Python:
import pandas as pd
import numpy as np
import requests
Next, copy the code provided by RapidAPI into your IDE, but exclude the import for the ‘requests’ library since we’ve already done that. You can also skip the 'print(response.text)' line as it isn't necessary for our purposes.
querystring = {"symbol":"AAPL"}
headers = {
"X-RapidAPI-Key": "...",
"X-RapidAPI-Host": "yh-finance.p.rapidapi.com"
}
response = requests.request("GET", url, headers=headers, params=querystring)
Section 1.3: Loading Data into a DataFrame
The API returns data in JSON format, so we will load the response into a Pandas DataFrame using the following commands:
df = response.json()
df1 = pd.json_normalize(df)
Section 2: Preparing Financial Data
Now we will extract the financial statements we need. The Yahoo Finance API generates numerous column names, so filtering them to match our requirements is the best approach. If you wish to explore different columns, you can use a template function like df.loc[:, df.columns.str.contains('...')].
For our project, we’ll pull specific data:
balancesheet = df1.loc[:, df1.columns.str.contains('balanceSheetHistory.balanceSheetStatement')]
cashflow = df1.loc[:, df1.columns.str.contains('cashflowStatementHistoryQuarterly.cashflowStatements')]
incomestatement = df1.loc[:, df1.columns.str.contains('incomeStatementHistory.incomeStatementHistory')]
Section 2.1: Data Cleaning Function
We need to create a function to clean the nested JSON data we receive. This function will unwrap the data to extract the variables we want. Here’s how it works:
- Select the first cell from our financial sheets.
- Choose the desired column by its name.
- Load the data from JSON into a Pandas DataFrame.
- Rename the column to reflect the metric we want.
def clean(x, y):
df = pd.DataFrame(x.iloc[0, 0])
df = df.loc[:, df.columns.str.contains(y)]
df = pd.json_normalize(df[y])
df = pd.DataFrame(df.raw)
df.columns = [y]
return df
Section 2.2: Extracting Key Metrics
Here are examples of the financial metrics I focus on for stock screening:
revenue = clean(incomestatement, 'totalRevenue')
ebit = clean(incomestatement, 'ebit')
equity = clean(balancesheet, 'totalStockholderEquity')
debt = clean(balancesheet, 'longTermDebt')
If you're interested in other metrics, you can adjust the functions accordingly. Don’t forget to set the Pandas display options so your DataFrame isn’t truncated:
pd.set_option('display.max_columns', None)
pd.DataFrame(balancesheet.iloc[0, 0])
Section 2.3: Combining Metrics
To consolidate all metrics into one DataFrame, use the following command:
df = pd.concat([revenue, ebit, equity, debt], axis=1)
Section 2.4: Calculating Financial Ratios
While Yahoo Finance provides some financial ratios, we can calculate them directly using our raw numbers:
df['Operating Margin'] = df['ebit'] / df['totalRevenue']
df['DE'] = df['longTermDebt'] / df['totalStockholderEquity']
df['RoE'] = df['ebit'] / df['totalStockholderEquity']
df['RoIC'] = df['ebit'] / (df['totalStockholderEquity'] + df['longTermDebt'])
Chapter 3: Evaluating the Results
Here’s an example of the output for Apple. Note that Yahoo Finance provides only the last four years of financial data, with the latest annual report year being 2021.
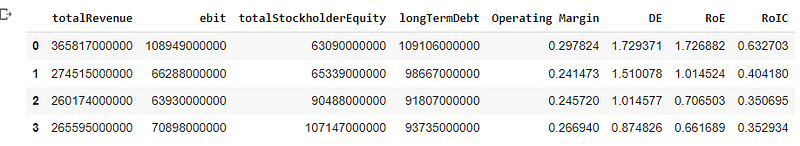
From my own analysis of Apple's annual reports, the figures are in billions.

While the numbers may not match exactly, they remain sufficiently consistent with the actual reports.
Section 3.1: Interpreting the Data
This process enables me to quickly screen companies. If a firm shows negative earnings consistently, I know to avoid it and focus on more promising opportunities.
For a more detailed interpretation, I look for:
- Year-on-year EBIT growth with strong operating profit margins (e.g., >10%).
- This growth should not come at the expense of increased equity or borrowing. I aim to ensure that the company is not merely 'buying' growth but is instead making its products increasingly desirable over time.
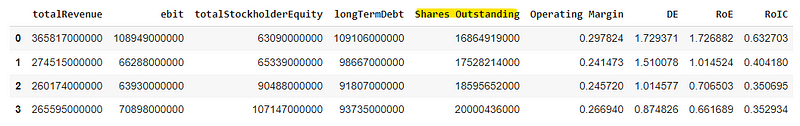
Section 3.2: Detecting Capital Raising
To determine if a company's growth stems from capital raising, utilize the following code. An increase in outstanding shares year over year indicates that the growth is likely due to capital raising. While management's stock options can dilute shares, a capital-raising strategy usually results in greater dilution.
df2 = pd.DataFrame(df1)
df3 = df2.loc[:, df1.columns.str.contains('timeSeries.annualDilutedAverageShares')]
df4 = clean(df3, 'reportedValue')
shares = df4[::-1].reset_index(drop=True)
shares.columns = ["Shares Outstanding"]
df = pd.concat([revenue, ebit, equity, debt, shares], axis=1)
Chapter 4: Additional Resources
If you found this guide helpful, consider joining Medium for more insightful articles from various writers. You can sign up using my link below, and I will receive a small commission.
This video titled "How To Build a Stock Screener | Python For Finance Episode 3" provides a great visual guide to creating stock screeners.
Check out "Python Programming Tutorial - How to Make a Stock Screener" for a step-by-step walkthrough on the same topic.